-
Web sayfası bildirimcisi
- EXPLORE
-
Blogs
Choosing the Right Candlestick Chart: Traditional vs. Heikin Ashi for Trading Success

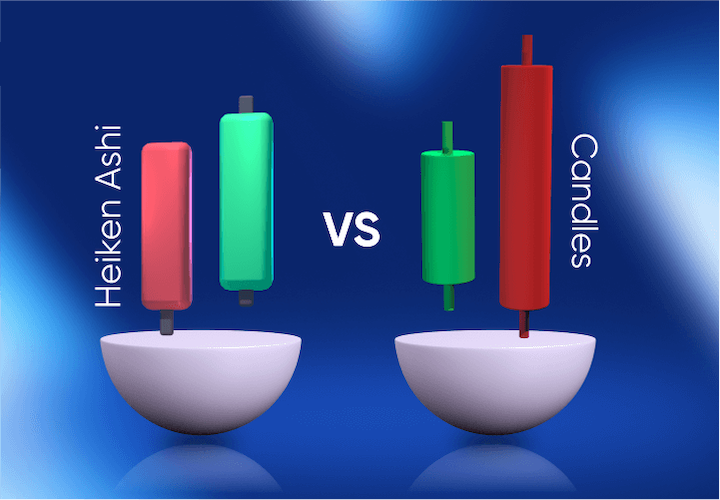
The choice between using traditional candlestick charts and Heikin Ashi (HA) candlestick charts depends on individual trading preferences, strategies, and goals. Both types of charts have their advantages and disadvantages, and neither is inherently more "accurate" than the other. It's essential to understand the characteristics of each chart type and how they might align with your trading style.
Here are some key points to consider for both types of candlestick charts:
-
Traditional Candlestick Charts:
- Accuracy of Price Representation: Traditional candlesticks represent the open, high, low, and close prices for a specific time period. Traders who prefer accurate representation of price levels often choose traditional candlestick charts.
- Reaction to News and Events: Traditional candlesticks respond more quickly to price changes, making them suitable for traders who want to react swiftly to news and events affecting the market.
-
Heikin Ashi Candlestick Charts:
- Smoothing Effect: Heikin Ashi candles are calculated using a formula that incorporates the open, high, low, and close of the previous candle. This results in a smoother appearance that can help filter out market noise and provide a clearer trend direction.
- Trend Identification: HA charts can be particularly useful for trend identification, as they may help traders stay in a trend for a more extended period by reducing the impact of short-term fluctuations.
- Less Sensitive to Market Noise: Heikin Ashi charts are less sensitive to price fluctuations, which can be an advantage in certain market conditions.
Ultimately, the "accuracy" of a chart type depends on the trader's goals and strategies. Some traders may find traditional candlestick charts more suitable for quick decision-making, while others may prefer the smoothed trends provided by Heikin Ashi charts.
It's essential to backtest and experiment with both chart types to determine which one aligns better with your trading objectives. Additionally, consider combining various chart types and indicators to create a comprehensive trading strategy that suits your preferences. Keep in mind that no chart type is universally superior, and success in trading depends on how well a strategy is executed and managed.
- Aspiration
- Banking
- Bitcoin
- Blockchain
- Centralization
- Crypto Asset
- Decentralization
- EĞİTİM BİLGİLERİ
- Fiat Currency
- Inspirational
- SATS
- Technology
- Trade
- Traditional Finance
- Web 3
- Web 5
- Web/Cyber
- Web/Cyber/Hack
- Web Evolution
- Web/Internet
- Web/Wellness
- Web/Internet/Other


