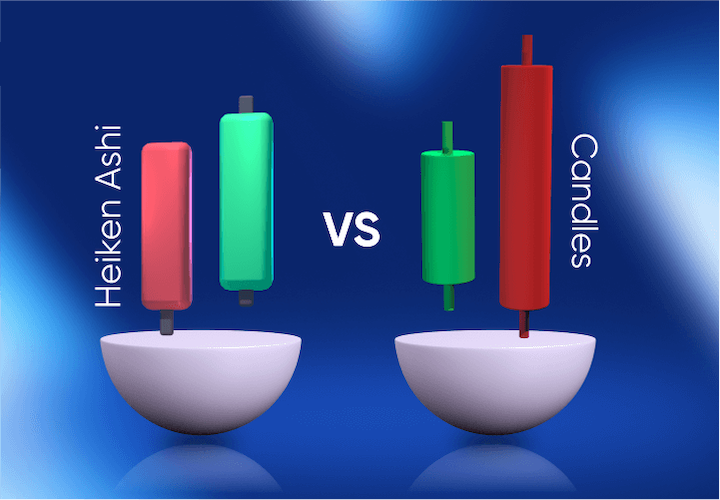
• To the private questions relating to using Heikin Ashi charting, I strongly suggest to use default TradingView Candles, that are more accurate to per trades and thus my algorithm shines with it (unlike many other strategists who mystify with Heikin Ashi candles in their algo). A true returns are obvious with default candlesticks chart. Stick with it.
    To the private questions relating to using Heikin Ashi charting, I strongly suggest to use default TradingView Candles, that are more accurate to per trades and thus my algorithm shines with it (unlike many other strategists who mystify with Heikin Ashi candles in their algo). A true returns are obvious with default candlesticks chart. Stick with it.
    CORESATS.COM
    Choosing the Right Candlestick Chart: Traditional vs. Heikin Ashi...
    The choice between using traditional candlestick charts and Heikin Ashi (HA) candlestick charts depends on individual trading preferences, strategies, and goals. Both types of charts have their advantages and disadvantages, and neither is inherently more
    0 Σχόλια 0 Μοιράστηκε 1χλμ. Views
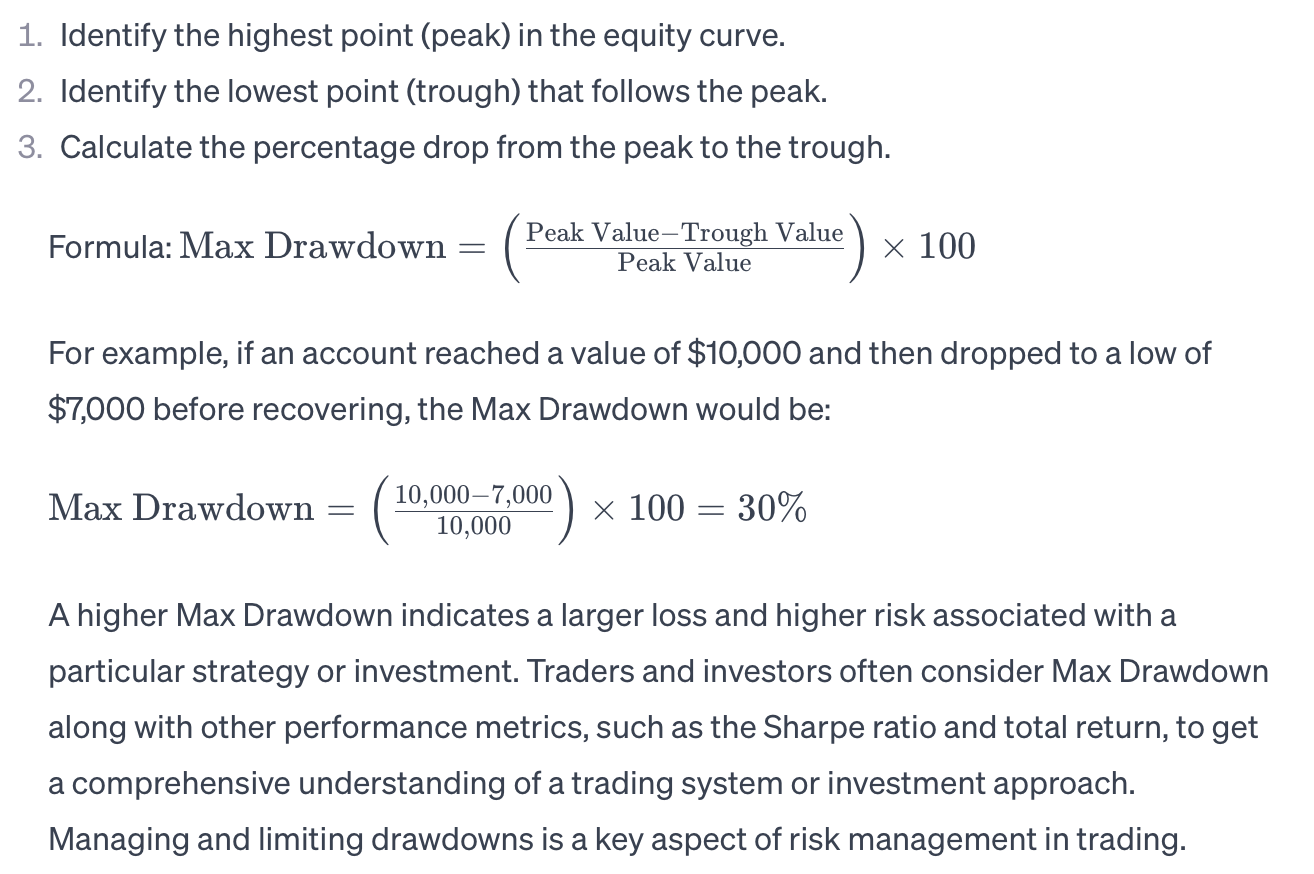
  • Now, let's look into what Max Drawdown is and how it impacts your profits. In TradingView and in trading and investing in general, "Max Drawdown" (or simply "Max Draw") refers to the maximum peak-to-trough decline in the value of a trading account or an investment portfolio over a specific time period, typically expressed as a percentage.

    The Max Drawdown is a measure of the largest loss that an account or portfolio has experienced from its highest point to its lowest point. It is an important metric because it helps traders and investors assess the risk associated with a particular strategy or investment.

    Here's how you calculate Max Drawdown:
    Now, let's look into what Max Drawdown is and how it impacts your profits. In TradingView and in trading and investing in general, "Max Drawdown" (or simply "Max Draw") refers to the maximum peak-to-trough decline in the value of a trading account or an investment portfolio over a specific time period, typically expressed as a percentage. The Max Drawdown is a measure of the largest loss that an account or portfolio has experienced from its highest point to its lowest point. It is an important metric because it helps traders and investors assess the risk associated with a particular strategy or investment. Here's how you calculate Max Drawdown:
    0 Σχόλια 0 Μοιράστηκε 904 Views
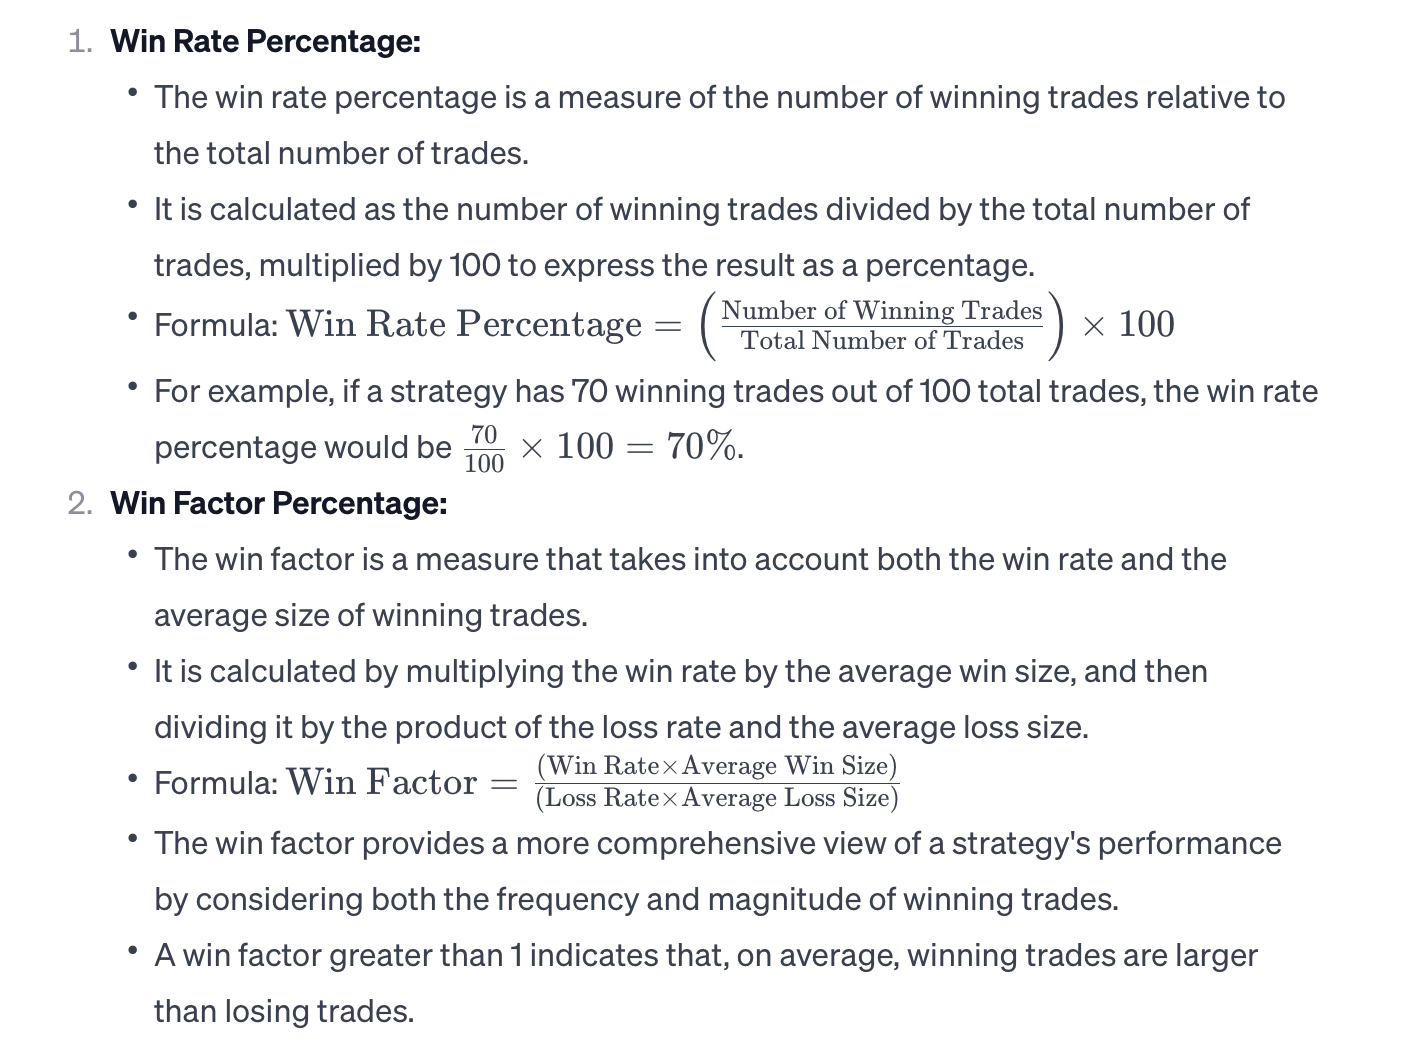
  • While entering and existing trades, focus on Win Rate and Factor. That will forecast incoming trades and their winning possibilities. In trading and financial analysis, "win rate percentage" and "win factor percentage" are terms used to describe different aspects of a trading strategy's performance. In summary, while the win rate percentage focuses solely on the proportion of winning trades, the win factor percentage incorporates both the win rate and the size of winning and losing trades to provide a more nuanced evaluation of a trading strategy's effectiveness. Here's an explanation of each:
    While entering and existing trades, focus on Win Rate and Factor. That will forecast incoming trades and their winning possibilities. In trading and financial analysis, "win rate percentage" and "win factor percentage" are terms used to describe different aspects of a trading strategy's performance. In summary, while the win rate percentage focuses solely on the proportion of winning trades, the win factor percentage incorporates both the win rate and the size of winning and losing trades to provide a more nuanced evaluation of a trading strategy's effectiveness. Here's an explanation of each:
    0 Σχόλια 0 Μοιράστηκε 687 Views